PROBLEMS AND SOLUTIONS 1

SCIENCE
A science is a body of facts systematically arranged and operating according to general laws.
SUBJECTIVE / OBJECTIVE
In biology, we can approach the same problem either subjectively or objectively – depending on our theory structure.
SUBJECTIVE
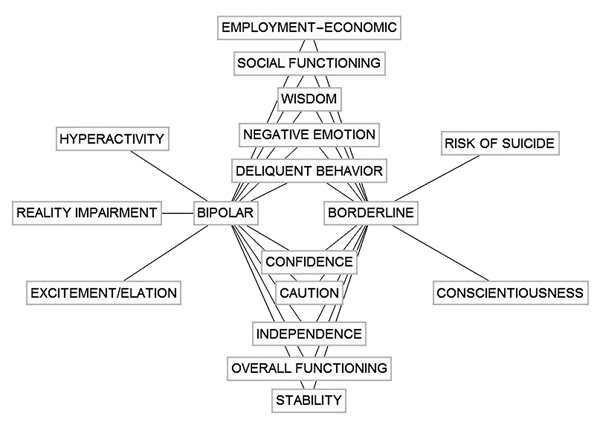
Consider clinical diagnosis wherein a physician must distinguish between disorders carrying similar symptoms. Bipolar and borderline personality disorders offer such an example.
Symptoms offer subjective measures.
OBJECTIVE
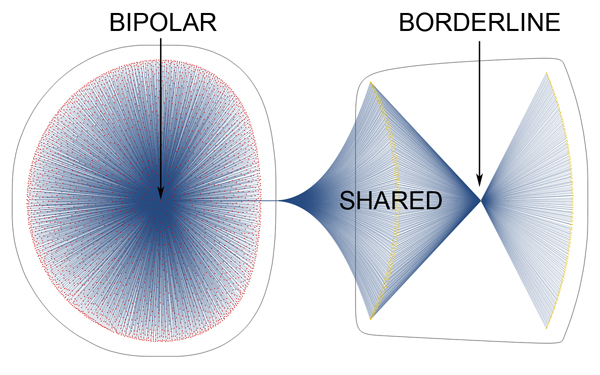
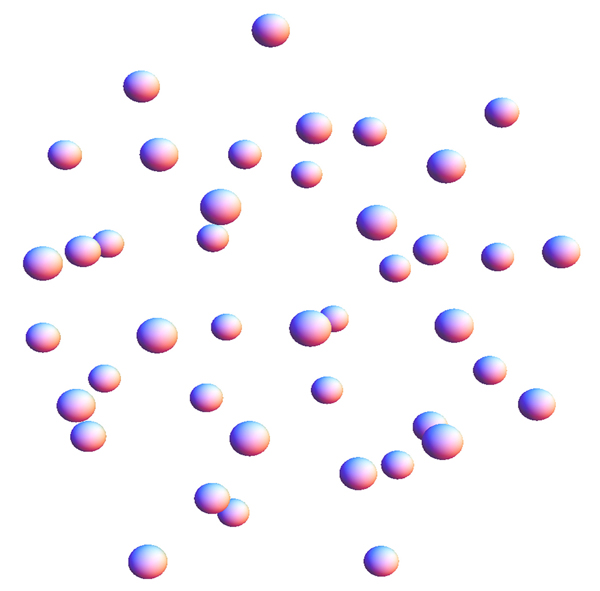
Alternatively, we can elect an objective approach by translating the MRI data of patients into quantitative patterns that show the relationship of parts to connections.
Dots represent disorders and mathematical markers, whereas blue lines identify connections.
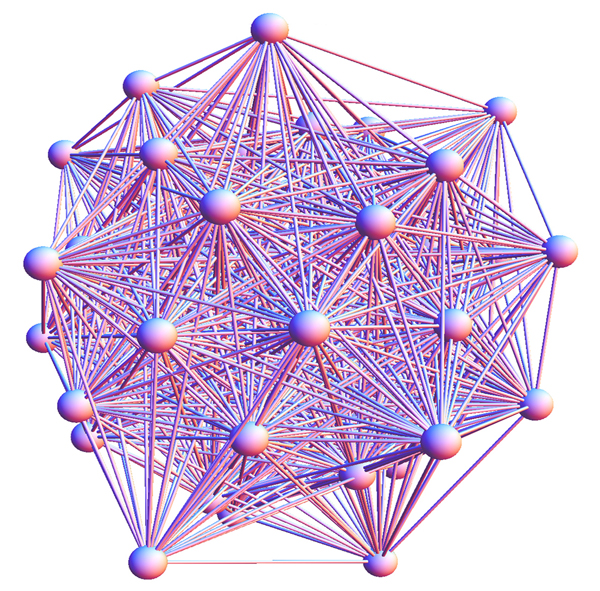
OBJECTIVE
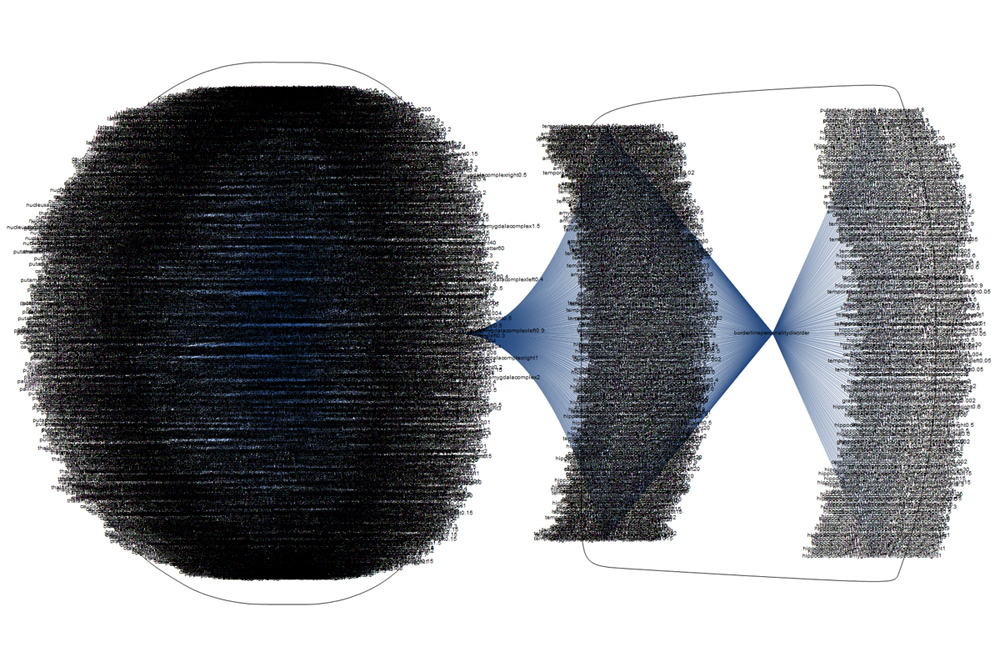
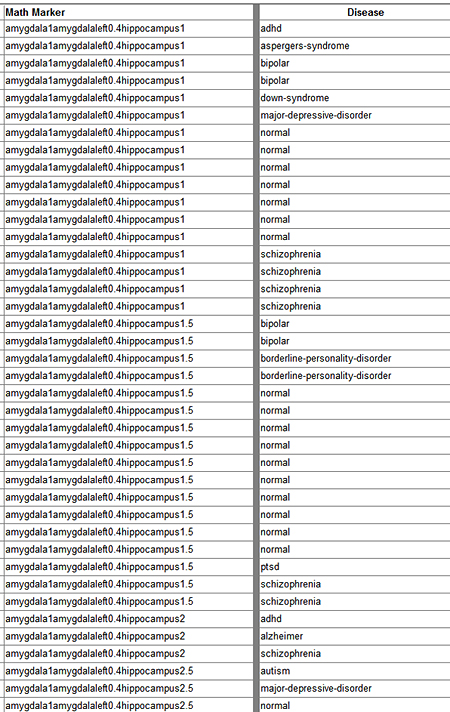
In turn, we can replace the dots with the names of the disorders and mathematical markers they represent. Right click the image to magnify.
The book explains how databases populated with such information can become powerful diagnostic and predictive tools.
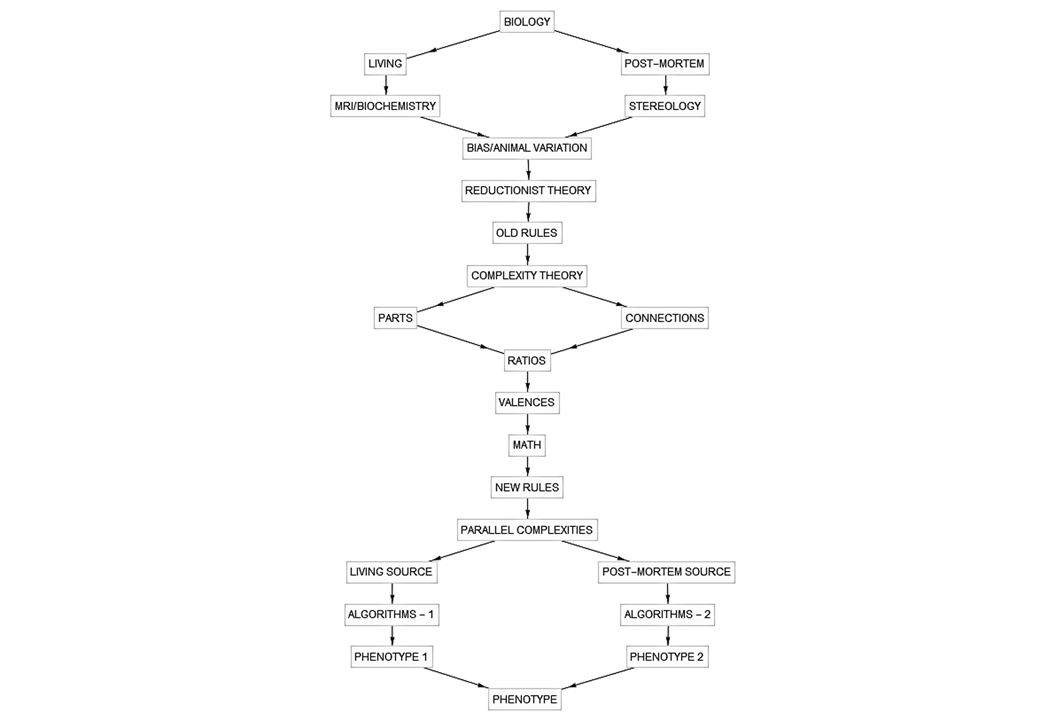
THEORY STRUCTURE
A theory structure defines the rules.
It determines what our data can do.
REDUCTIONIST THEORY
Reductionist theory sees biology as a collection of disconnected parts.
By taking biology apart, it delivers the parts, but not the connections. Make no mistake, it assumes that we can play the biology game successfully with only half the information. When applied to biology, which is a complexity, such an assumption produces a 50% science.
Unfortunately, a 50% science is often no science at all – as the story will show.
COMPLEXITY THEORY
Complexity theory sees the same set of parts as a highly connected set.
With both parts and connections in play, biology can be explored as a complexity consisting of mathematical puzzles.
The book explains how to set up and solve such puzzles.
PHENOTYPE
Progress in biology depends importantly on our ability to understand the complex relationship of genotype to phenotype.
The book focuses on the phenotype because it is – far and away – the best source of complexity.
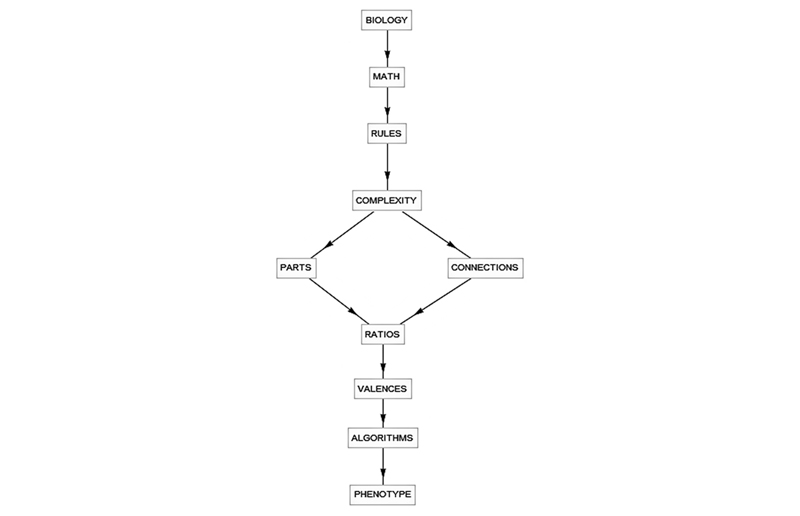
BIOLOGY
A phenotype is the translation of a genome into a complex organism.
Biology performs this translation the easy way.
Right click the image to magnify.
BIOLOGICAL SCIENCES
We prefer to do it the hard way.
We get to deal with two complexities. One produced by biology and and a second one produced by our theory structure – reductionism.

STATISTICIANS
Statisticians report that we can expect our published results to be correct only about 20 to 30% of the time. Apparently, research data are being overwhelmed by the biases coming from our experimental methods. If true, this is embarrassing because we are being bested by a simple coin toss.
RESEARCH DATA
Obviously, something is sadly amiss.
GOING TO THE SOURCE
We begin by considering three sources of noise in our data – bias, biological variation, and valence.
DEFINITION
A systematic distortion in data produces bias. It limits our ability to detect differences, or, in the case of biology, changes.
A 50% EFFORT
Recall that reductionist theory allows us to look at only some of the data, the parts but not the connections.
SOURCES OF BIAS
Practically everything we do in the lab introduces bias. Consider, for example, the problem of counting molecules.
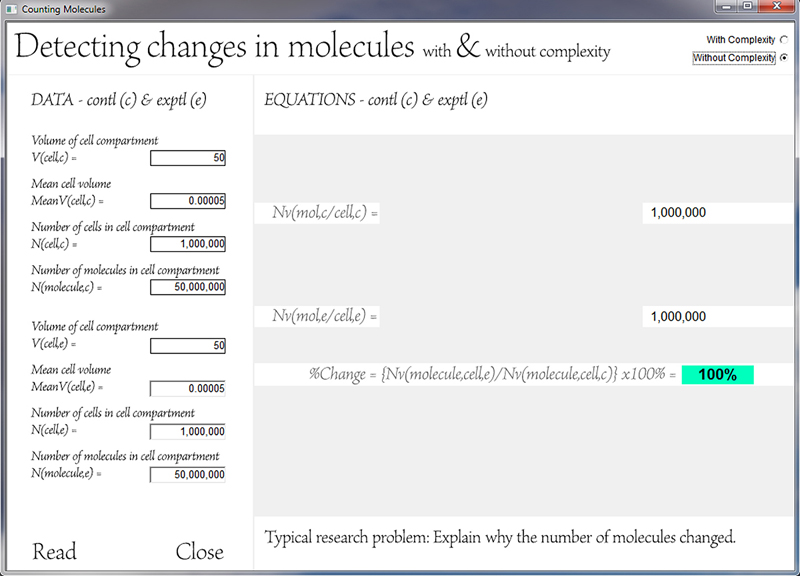
COUNTING MOLECULES - WITHOUT COMPLEXITY
Since the number of molecules in the control and experimental samples is the same, the %Change = 100%.
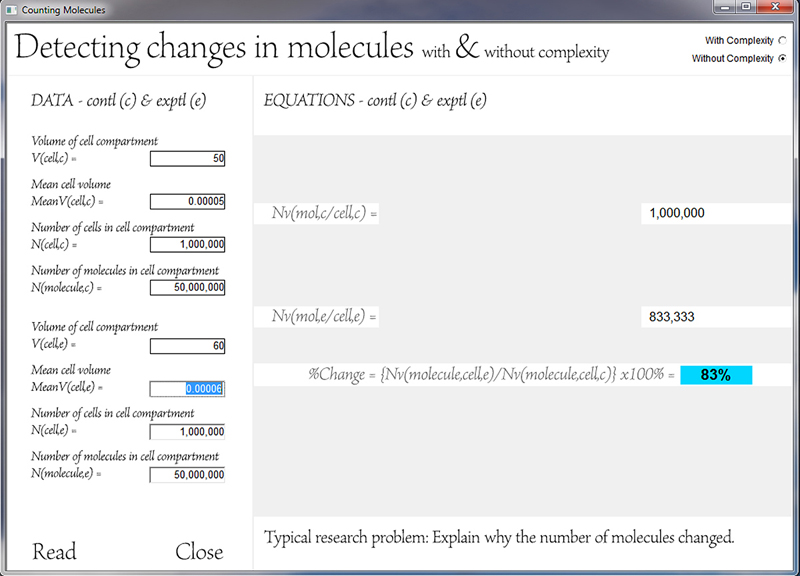
COUNTING MOLECULES - WITHOUT COMPLEXITY
If we run an experiment and discover that 83% of the molecules remain (compared to the control), we conclude that the number of molecules decreased by 17%.
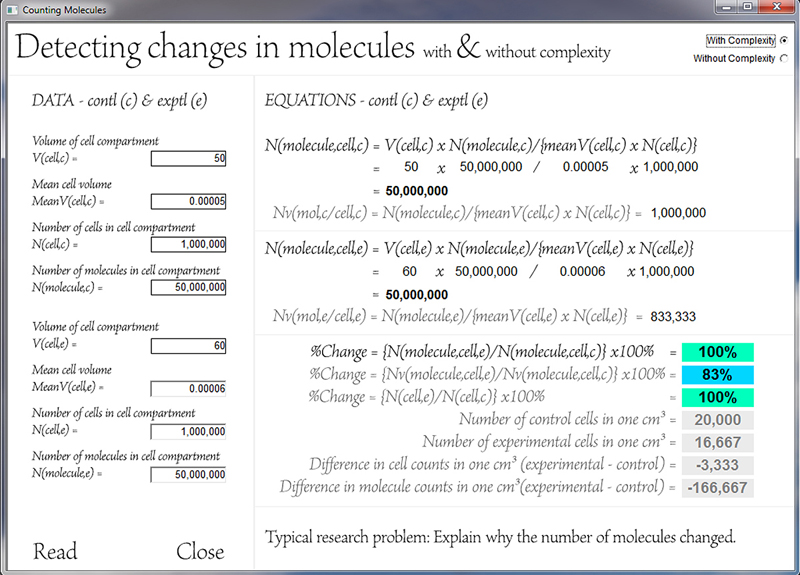
COUNTING MOLECULES - WITH COMPLEXITY
Reconnect the molecules to the cells, however, and we see that the decrease in the concentration of molecules was produced by a slight increase in the cell volume. The number of molecules remained constant. Right click the image to magnify.
DEFINITION
Biological variation refers to the amount a measure of a specific part can vary. The larger the spread, the harder it is to detect a significant difference between two sets of measurements.
It helps to make biological data noisy.
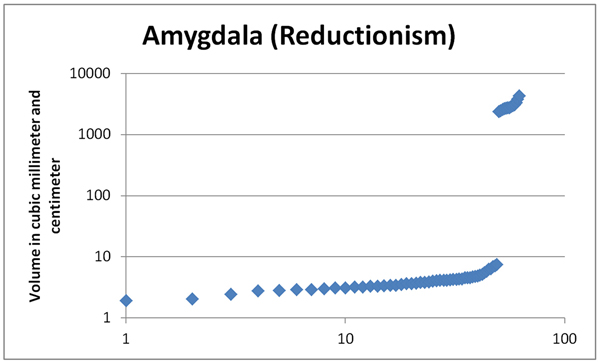
BIOLOGICAL VARIATION
Consider the amygdala of the human brain, which consists of a left and right component. When measured as isolated parts, the volumes display a wide range of values.
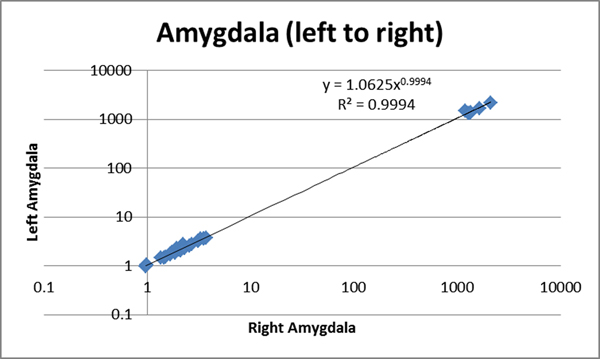
BIOLOGICAL VARIATION - GOING...
If, however, we plot the volume of the left side against that of the right, we find that all the points conveniently sit on the same line.
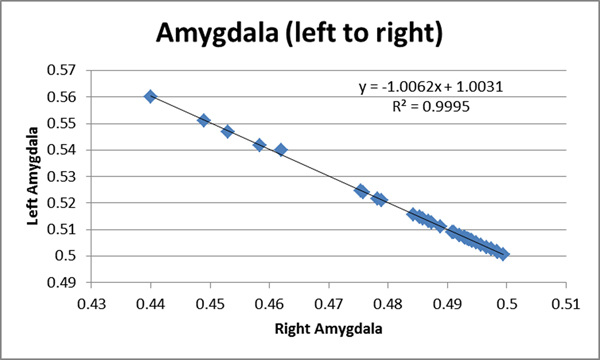
BIOLOGICAL VARIATION - ...GOING...
Next, if we express the volumes of left to right sides as ratios, the points continue to sit on the line with a surprising narrow range of values.
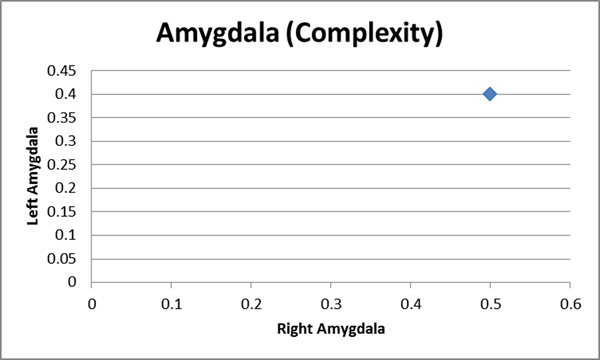
BIOLOGICAL VARIATION - ...GONE.
Finally, if we express all the left to right volume ratios as decimal repertoire values, all the points condense to form a single value. In effect, forming ratios of biological values minimizes variation. By taking its directions from biology, complexity theory makes difficult puzzles easy to solve.

DEFINITION
The quantity that determines the proportion of one part to another; an ability of a given part to connect to the same part in different ratios.
Biology defines and controls its complexity by using ratios of one part to another.
VALENCE - POSTMORTEM
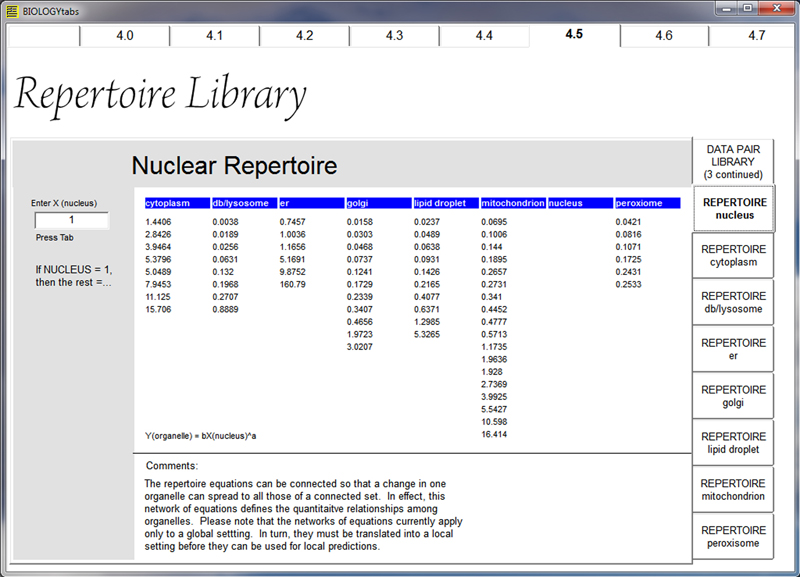
The ratio of the nucleus to a cell organelle can vary widely within and between cell types.
VALENCE - POSTMORTEM
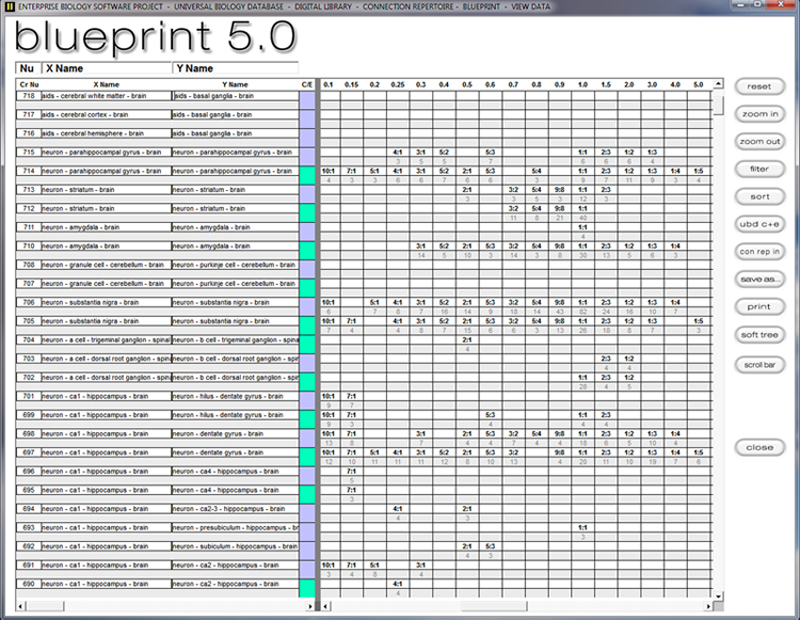
A blueprint reveals the range of the valences within and across species.
VALENCE - IN LIVING SUBJECTS
The human hippocampus, for example, displays multiple valences – differing more than a factor of two.

UNIVERSAL DATA
The primary role of data in a reductionist model is to detect local biological changes, whereas that of a complexity model is to use the same data to solve complex problems.
Data become universal when they share the same format and can interact mathematically.
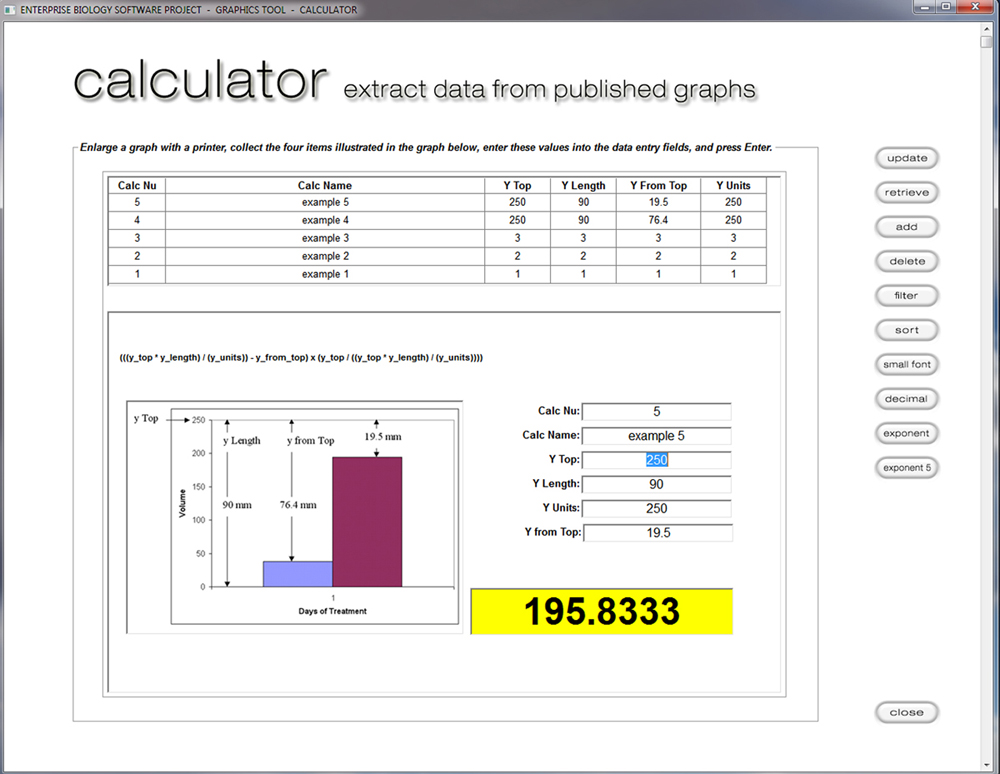
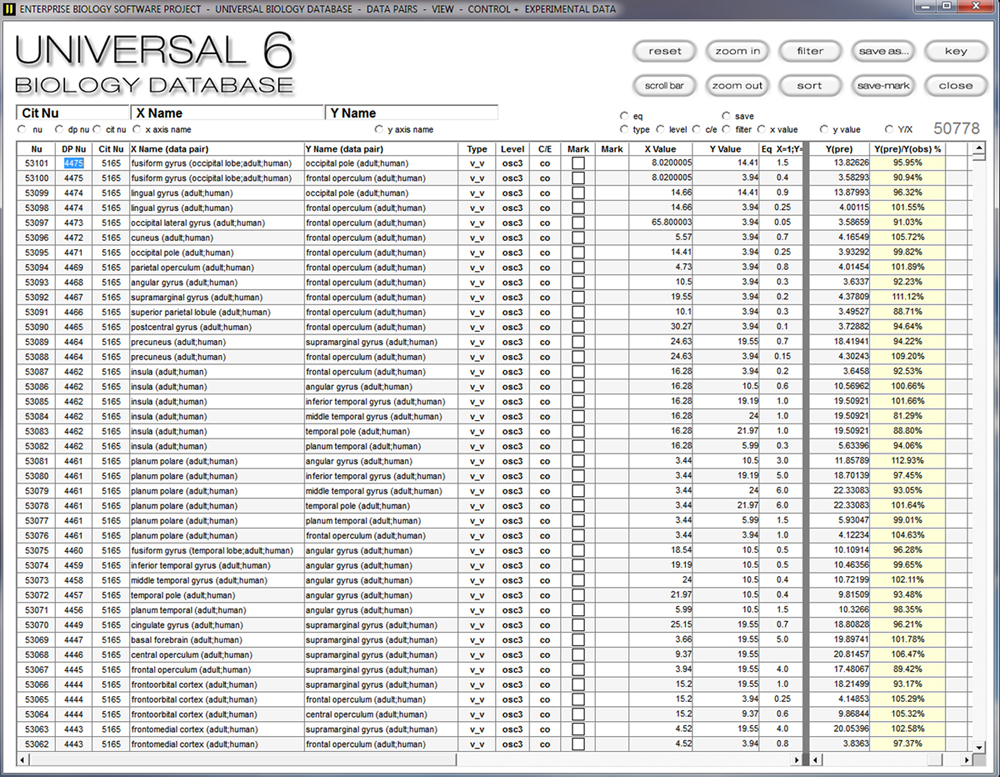
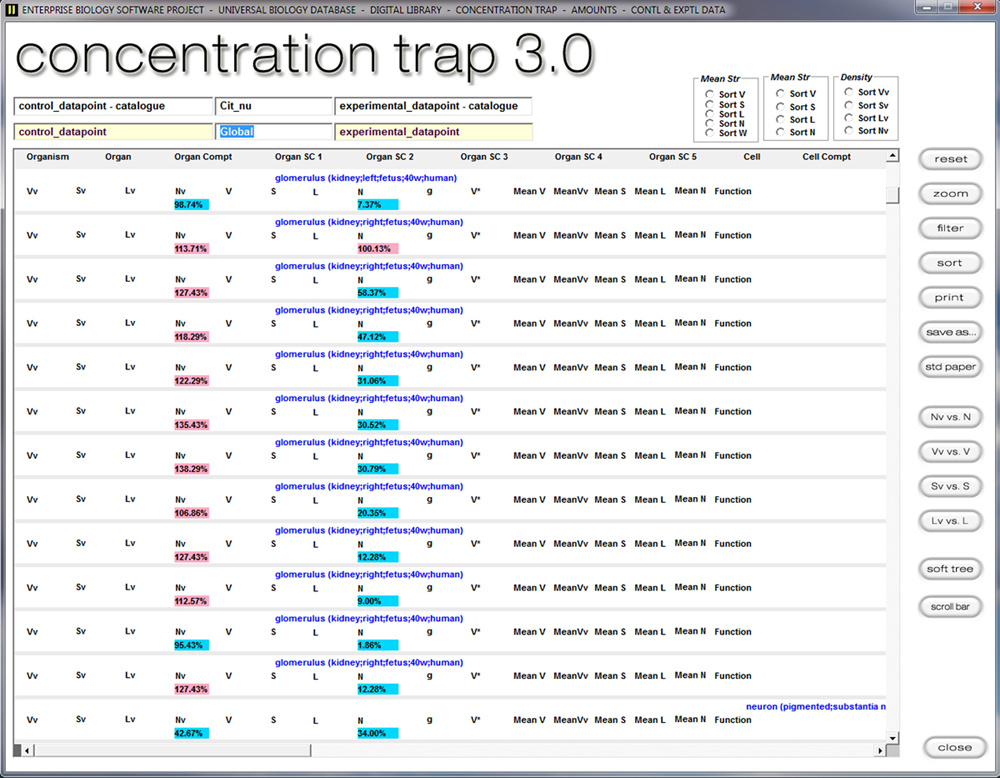
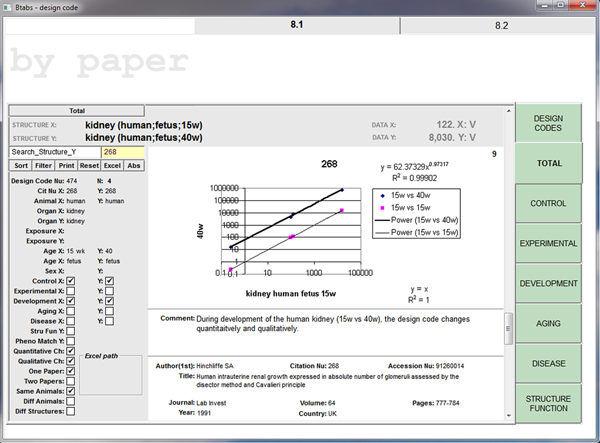
EXTRACTING DATA
Since a surprisingly large proportion of published data exist as graphs, assembling a universal data set involves capturing data from figures. Interactive screens, such as the one shown, simplify this process.
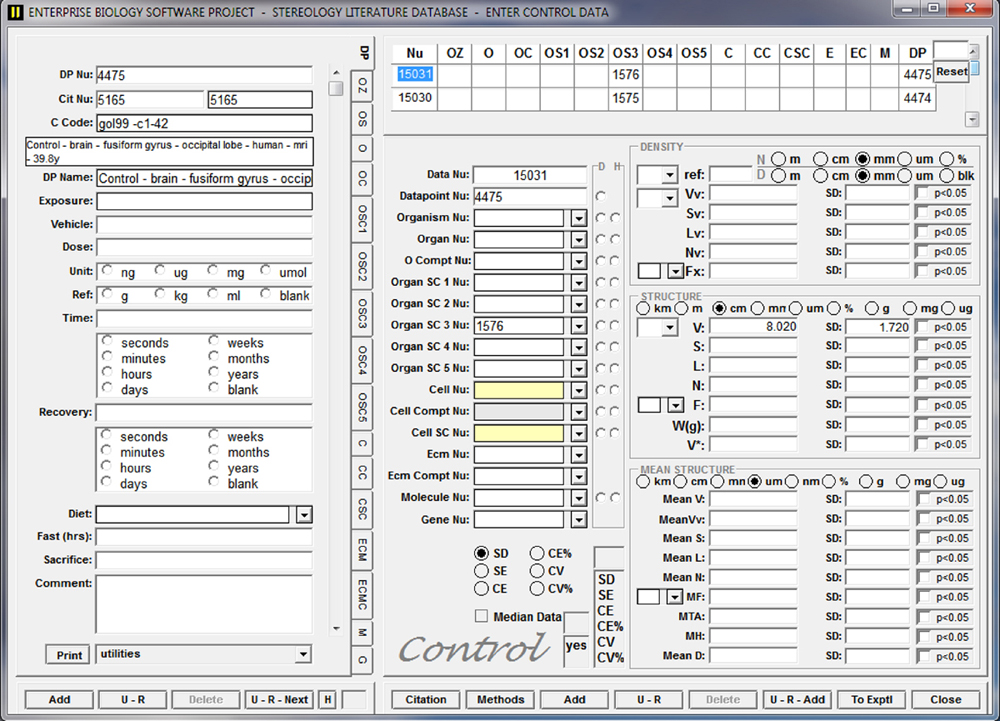
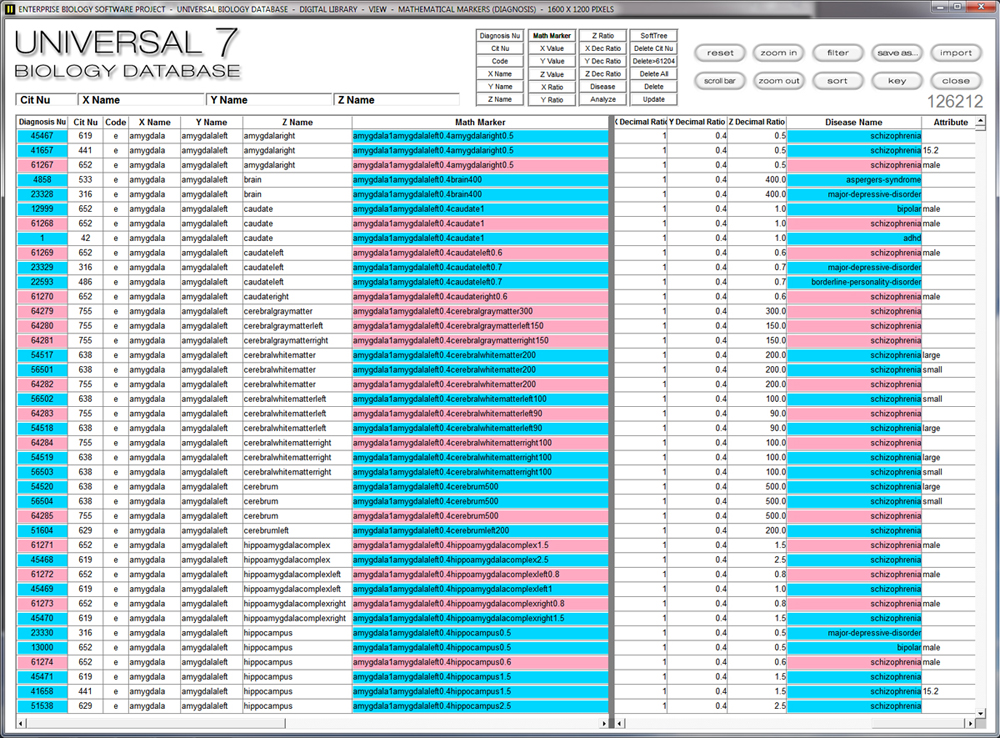
CATALOGING DATA
Data transferred to relational databases can be stored hierarchically, …
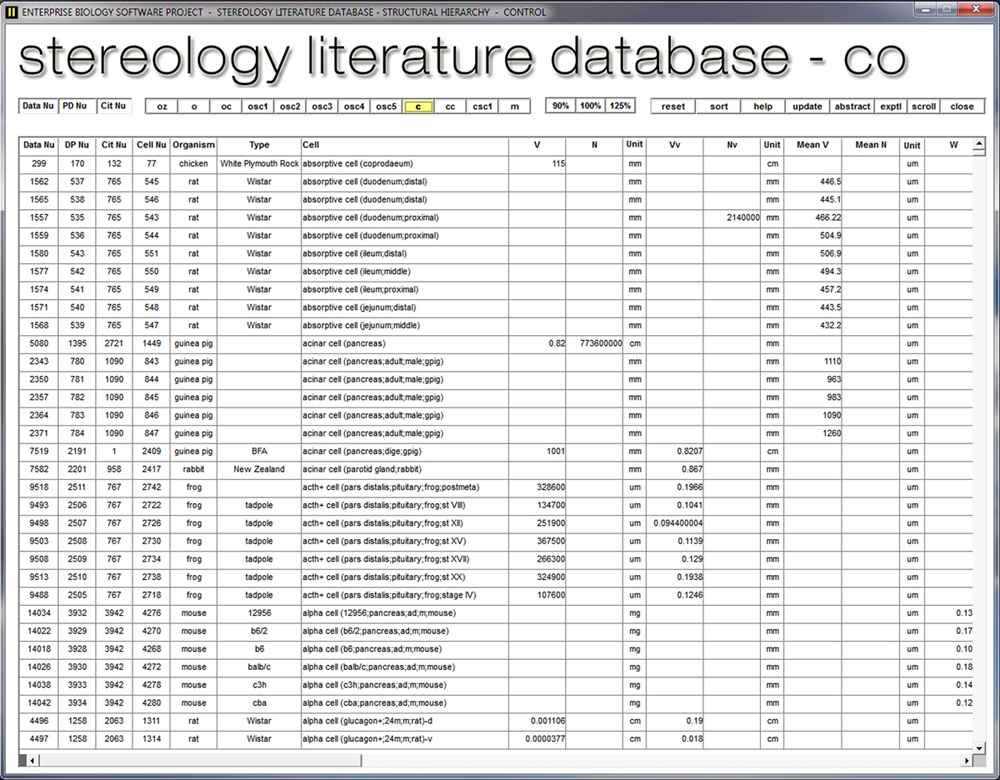
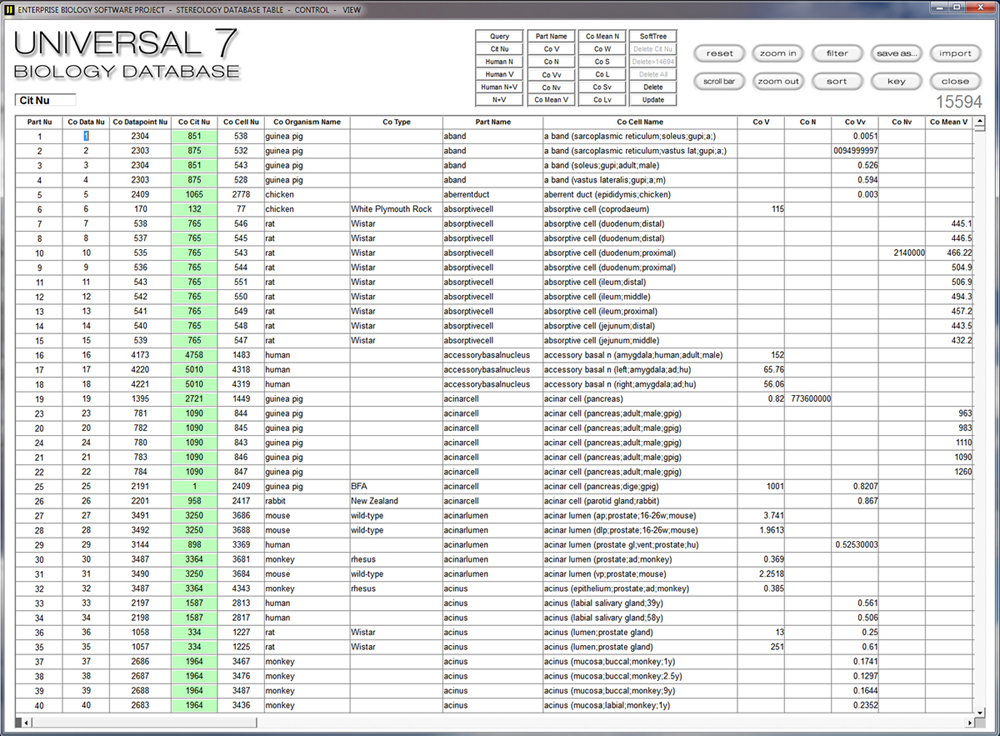
SORTING & FILTERING DATA
… viewed in data tables, …
TRANSFORMING DATA
…formed into ratios, …
WORKING DATA
… and used to solve specific problems (e.g., diagnosis).

INFORMATION
When data exist in databases, they can create new forms of information.
In effect, databases redefine our relationship to published data.
TRANSFORMING
Although they start out as a simple catalog of facts, data can generate complex patterns by forming connections. This transformation consists of forming ratios of one part to another.
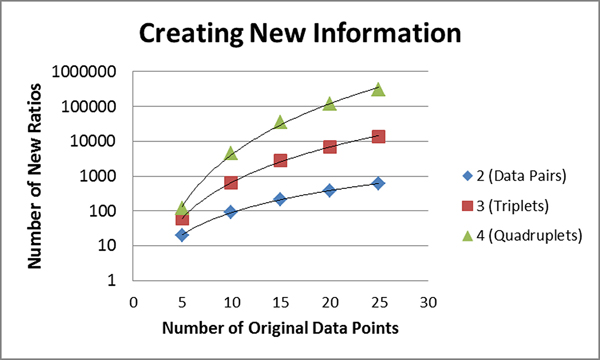
GROWING
A relatively small number of original data points taken from a single publication can become large numbers of patterns when expressed as data pairs, triplets, and quadruplets. Such strings can serve as mathematical markers.
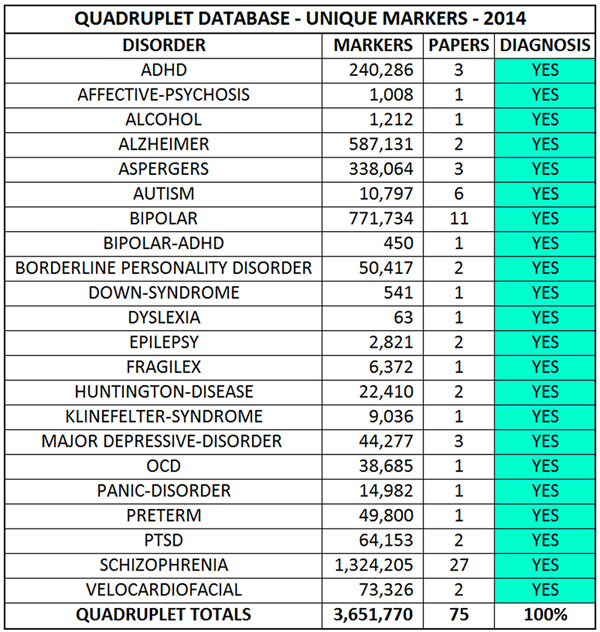
CONTRIBUTING
When interpreted as mathematical markers and held in a data cage, for example, global data sets can diagnose disorders of the brain with a reliably of 100%.

BIOLOGICAL CHANGE
A simple approach to biology looks for changes in data points, whereas a complex approach looks for changes in patterns.

SIMULATIONS
When we look at the behavior of parts theoretically, we find evidence of their interdependence. This means that we can expect to get many different answers to the same question.
DATA TRAPS
Research data offer confirmation in that we can find many examples where concentrations and absolute values fail to agree. Values highlighted in red signal an increase, whereas those highlighted in blue a decrease.
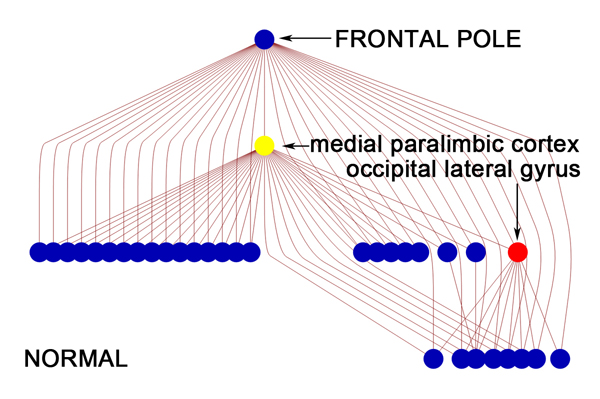
PATTERNS - BEFORE
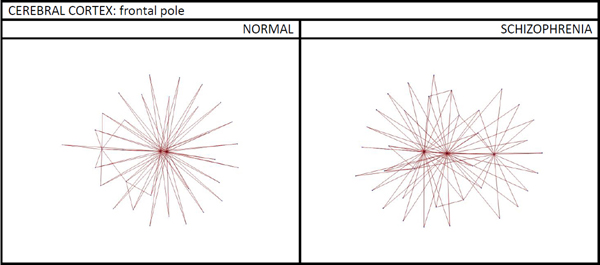
In a complexity, such as the human brain, a normal phenotype displays a pattern with one set of connections, but…
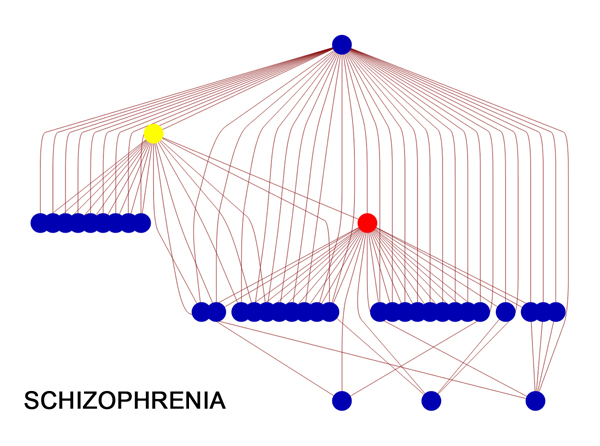
PATTERNS - AFTER
…quite a different pattern with different connections when a disorder exists.
PATTERNS - IN N-DIMENSIONAL SPACE
The same data can be viewed and rotated in three dimensions, or …
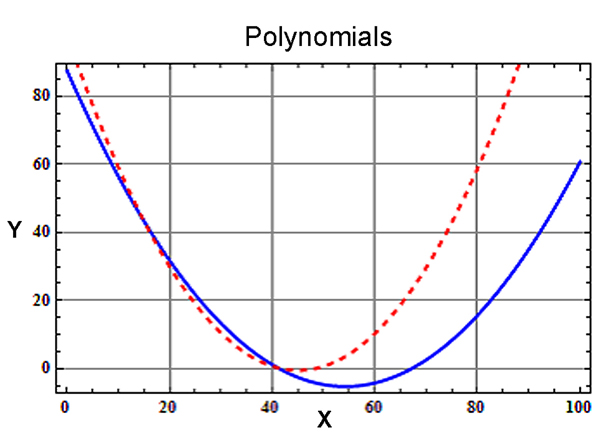
PATTERNS - AS EQUATIONS
…expressed as equations to quantify the differences that exist between normal (blue) and schizophrenic (red) brains.

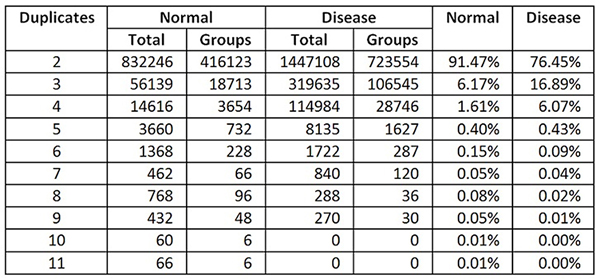
REPRODUCIBILITY
The touchstone of a quantitative science is an ability to reproduce results.
Biology – operating as a 50% science – struggles with the reproducible problem .
REPRODUCIBILITY - LOCAL - POSTMORTEM
Stereological data – collected postmortem – display such a capability locally (within a given paper), but…

REPRODUCIBILITY - GLOBAL - POSTMORTEM
…not often globally (between papers) for the same species.
REPRODUCIBILITY - GLOBAL - LIVING
A very different outcome exists for data collected from living subjects under the auspices of complexity theory. Now reproducibility becomes commonplace – both locally and globally in the same species.